
Report Features
The generated HTML report is a powerful single-page application with several views.
Dashboard View
The default view provides a high-level overview of the test run.
Pulse Report Dashboard Overview
Pulse Static Report Dashboard Overview
Key Components:
- Summary Cards: At-a-glance metrics for Total Tests, Passed, Failed, Skipped, Average Test Time, and Total Run Duration.
- Test Distribution Pie Chart: A visual breakdown of test results by status.
- System Environment Widget: Displays information about the execution environment.
- Test Suites Widget: Lists all test suites that were run, showing the test count and pass/fail/skip status for each.
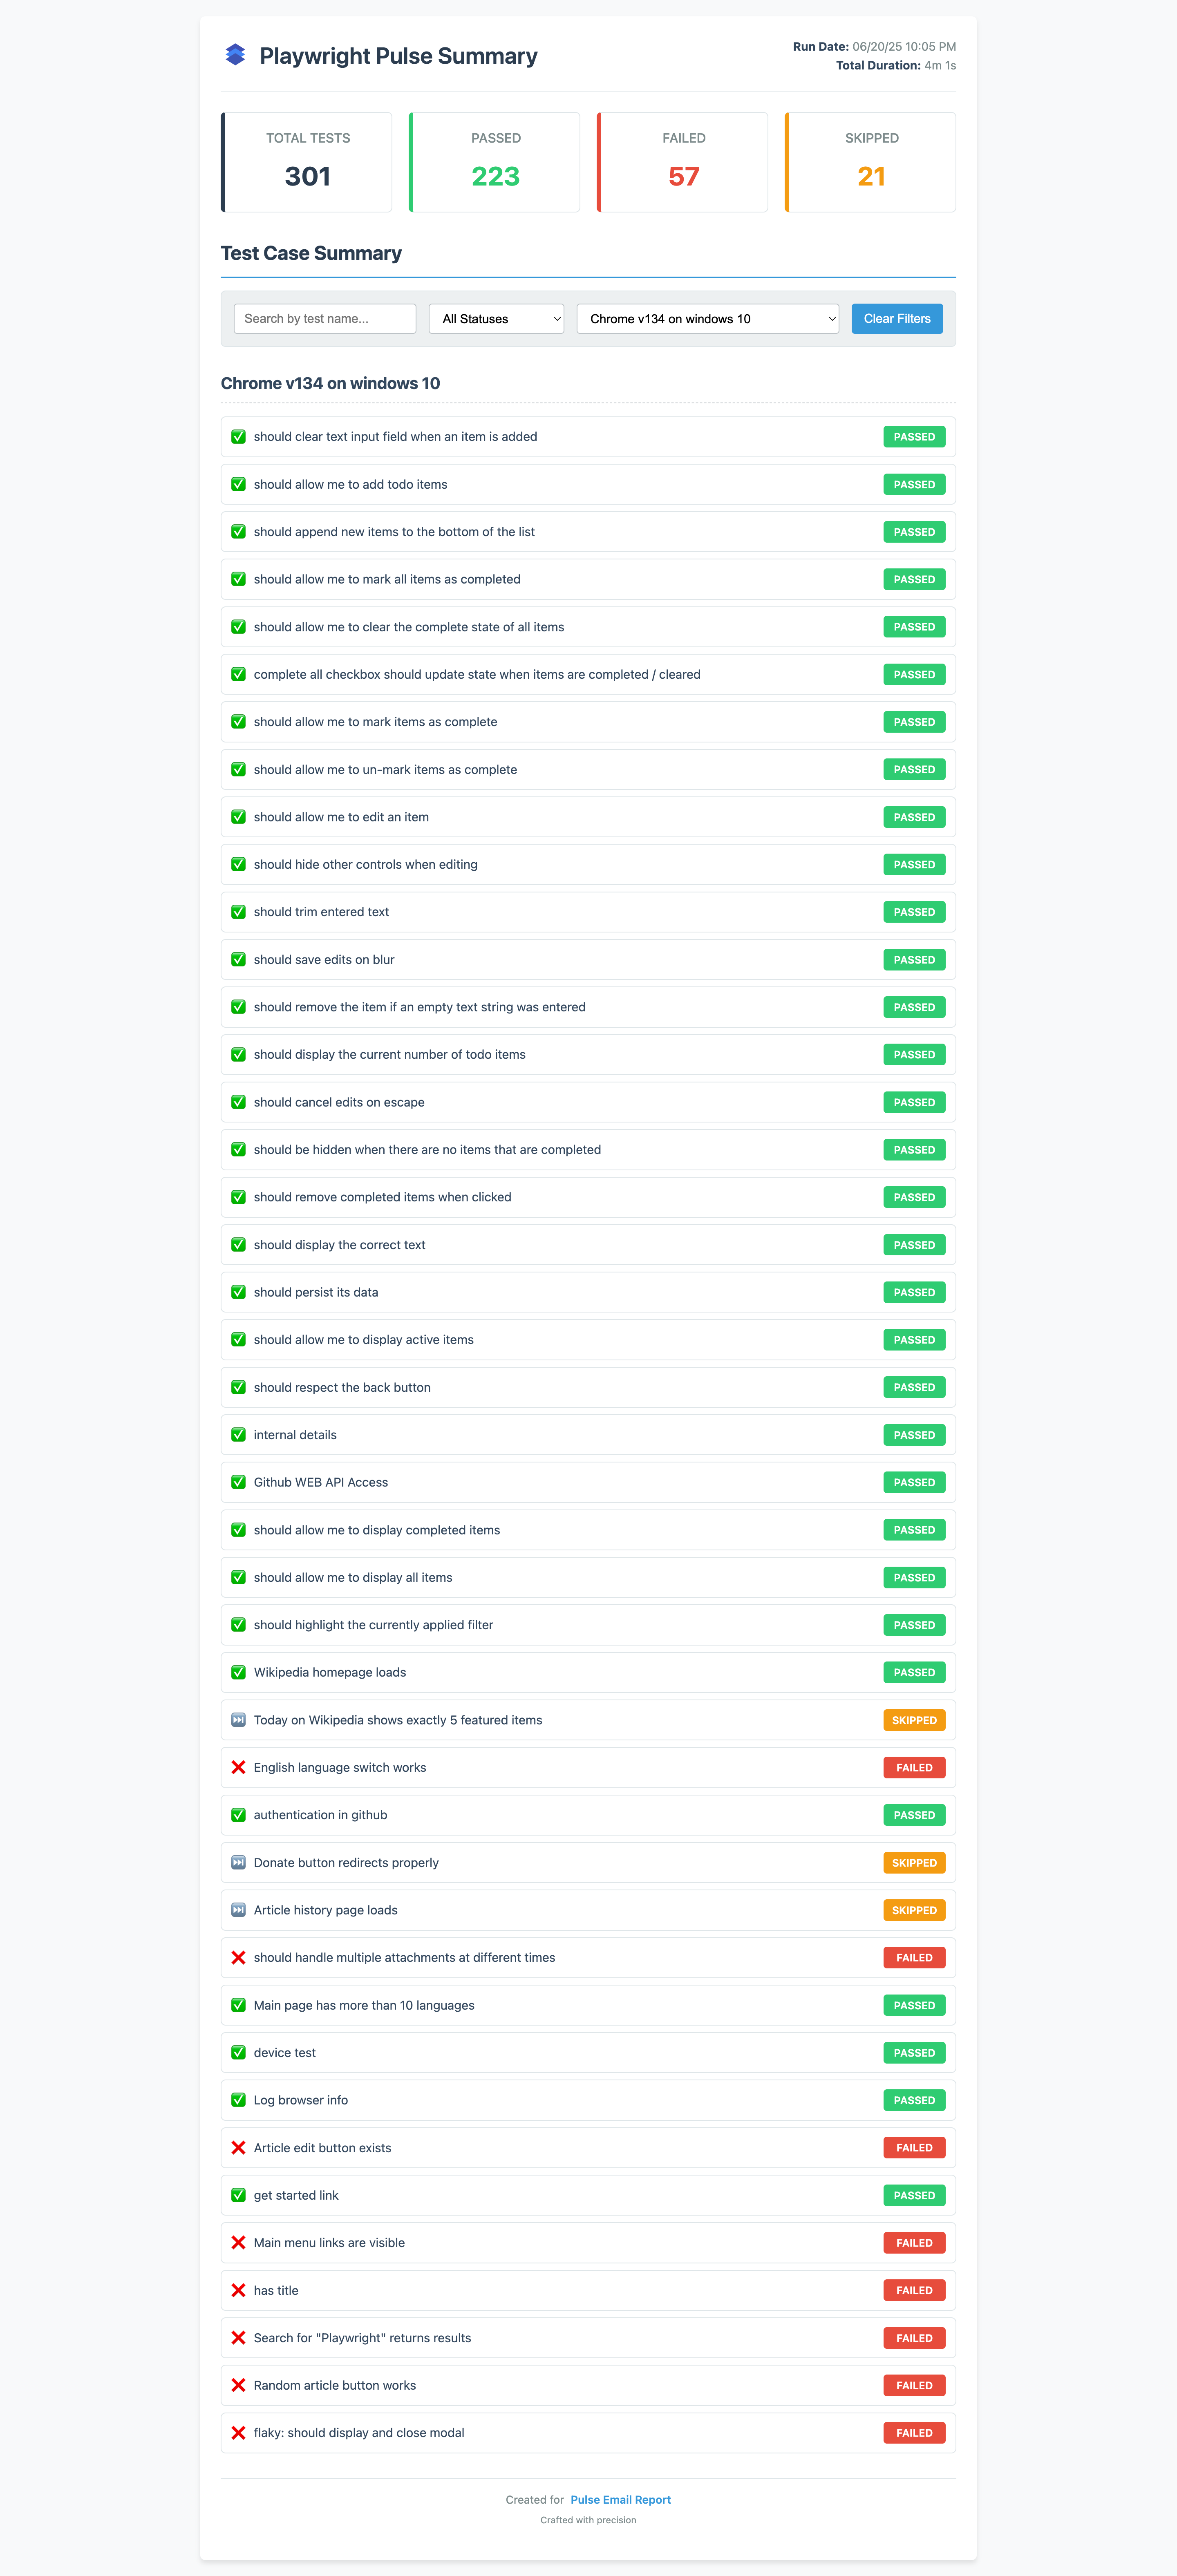
Test Run Summary View
This tab provides a detailed, filterable list of every test case in the run.
Pulse Report Test Run Summary

Pulse Report Test Details with Attachments
Key Components:
- Filtering: Powerful filters allow you to narrow down the view by test name, status (Passed, Failed, Skipped), and browser.
- Expandable Test Cases: Click on any test case to expand it and view its details.
- Step-by-Step Execution: See a full breakdown of every test step, including duration and status. Nested steps are indented for clarity.
- Error Details: For failed tests, the exact error message and a color-coded stack trace are displayed. A "Copy Error Prompt" button is available for easy debugging.
- Attachments: All associated screenshots, videos, traces and other attachment (html, csv, json, text, xml, etc.) files are displayed as thumbnails and are viewable or downloadable directly from the report.
- Annotations & Tags: Within all the test cases, user can add playwright's built-in annotations and tags to provide additional context or information.
-
Console Logs: Any
stdoutorstderroutput captured during the test is displayed in its own section. - Test Severity: Within all the test cases, user can now add test specific severity annotations to help categorize tests based on their importance or risk level. Also, in Dashboard, user can visualize the test severity distribution using a stacked-column chart. There are 5 severity levels: Critical, High, Medium, Low, and Minor.
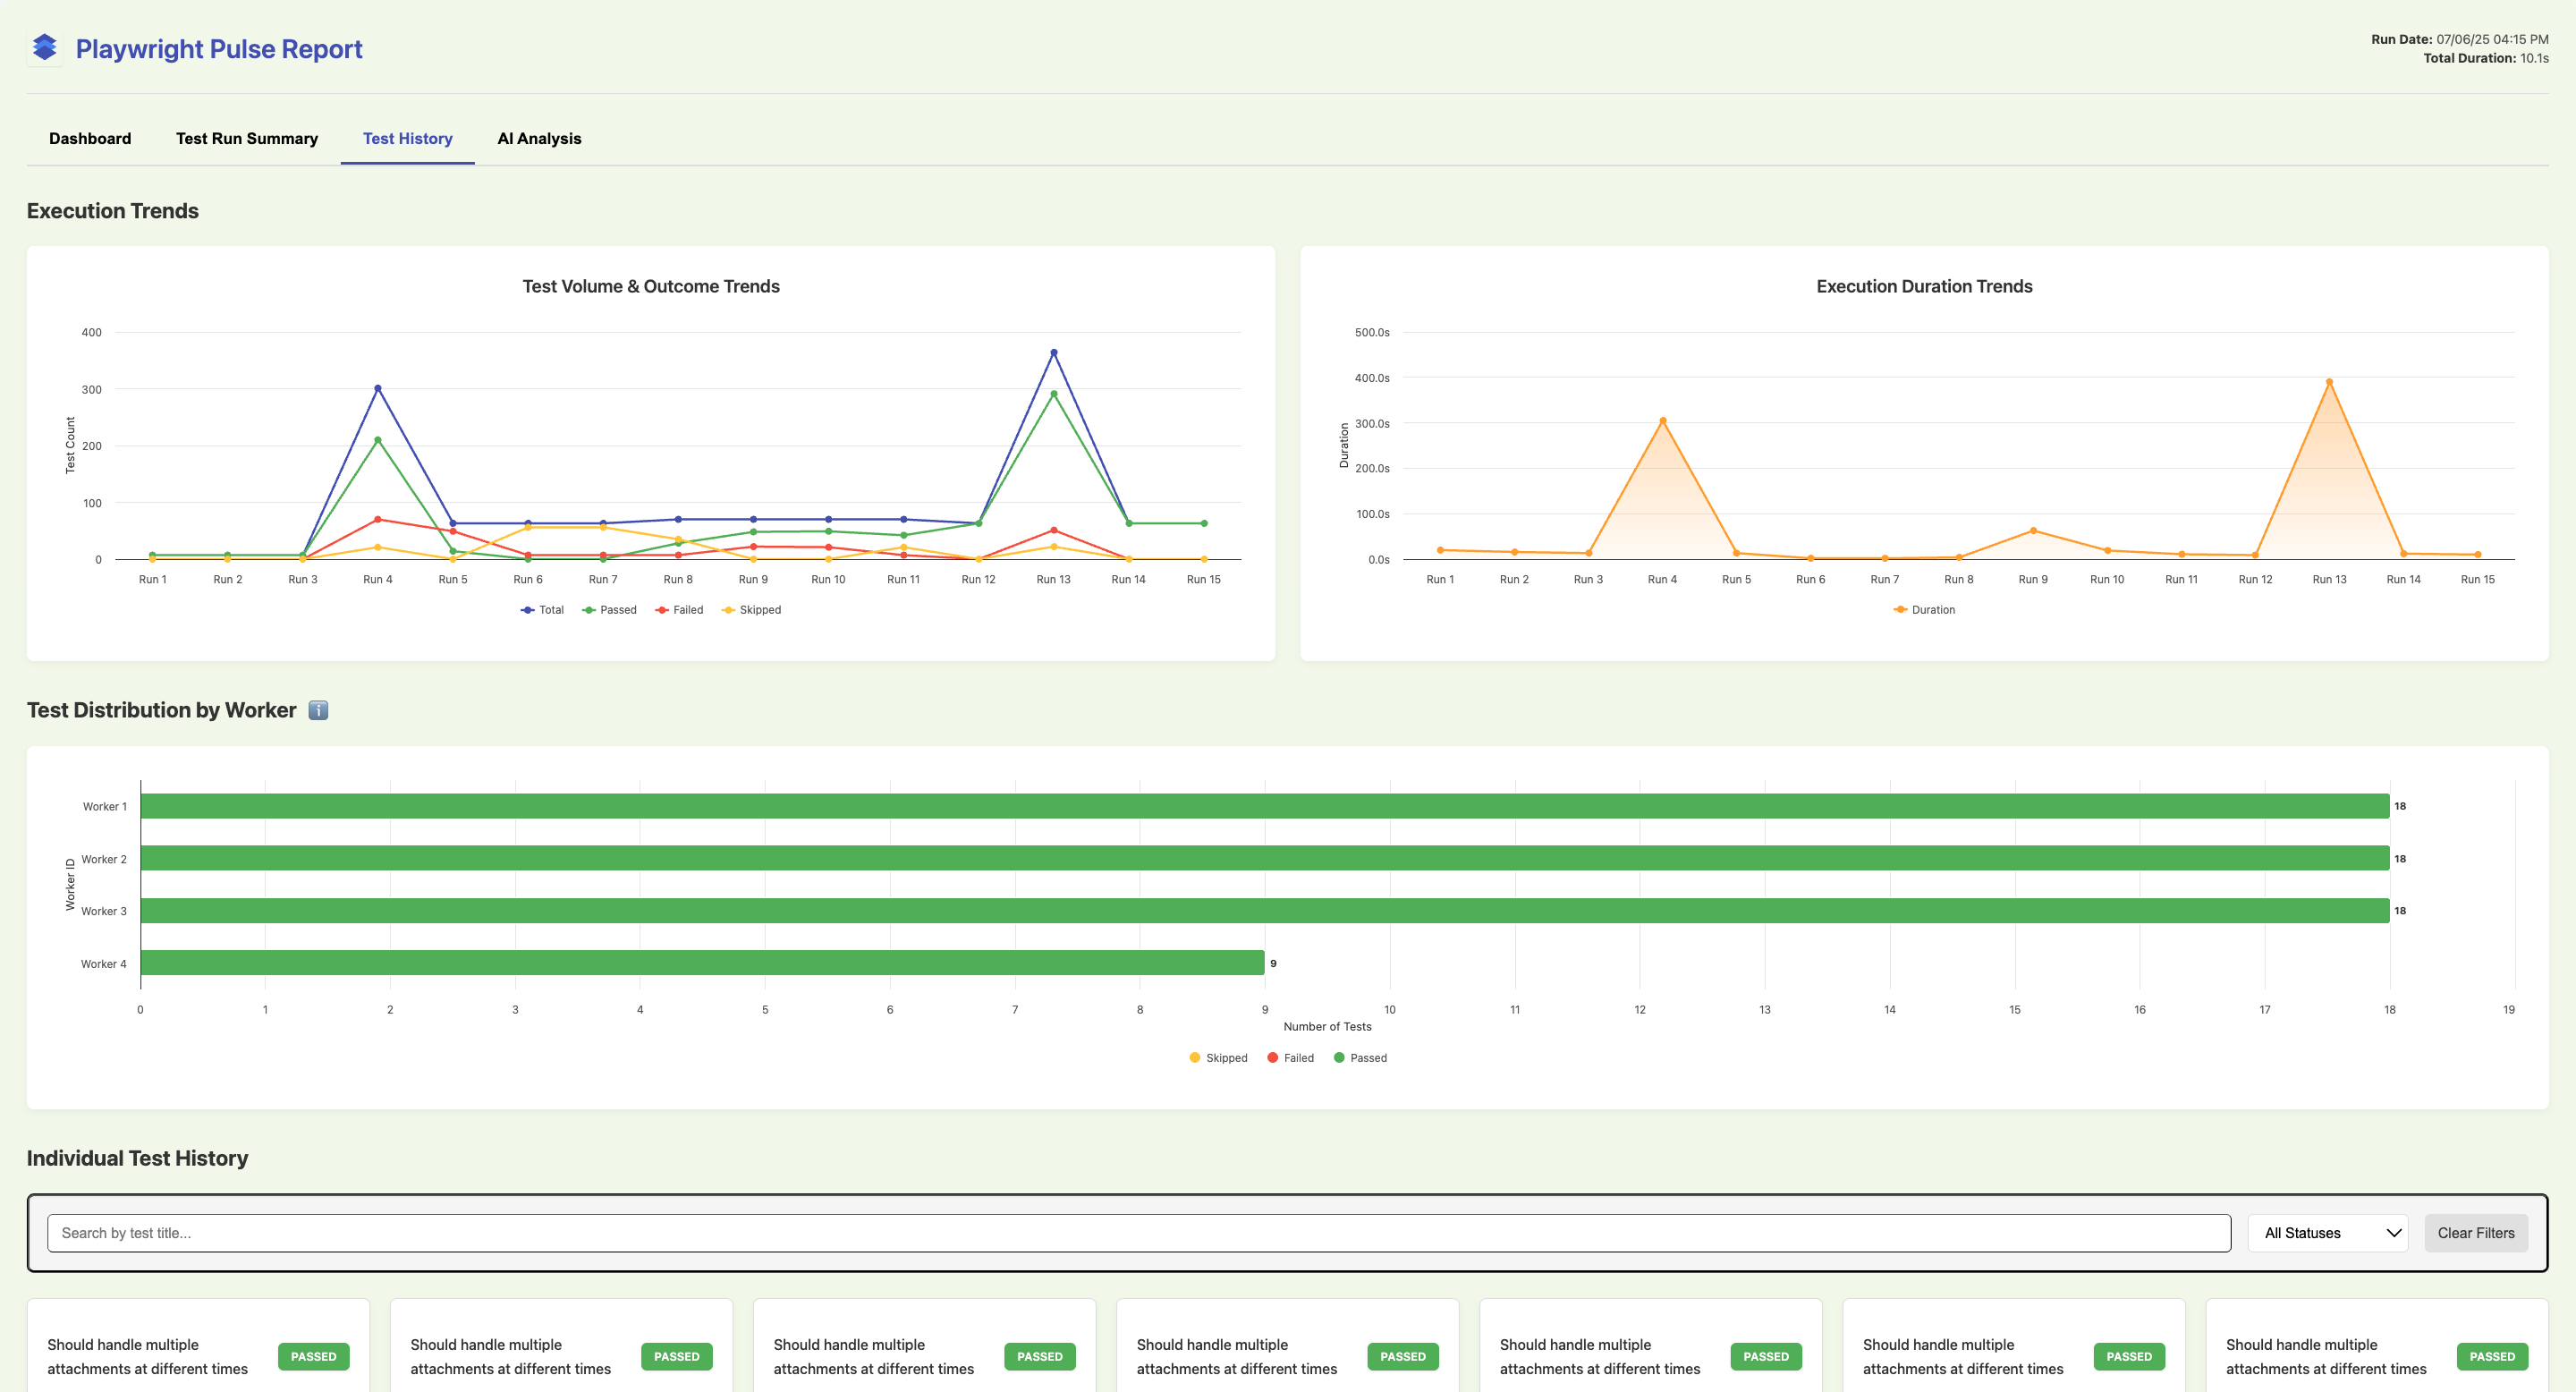
Test History View
This tab visualizes trends and historical data from the last 15 test runs.
Execution Trend Charts
Test History & Worker Trends
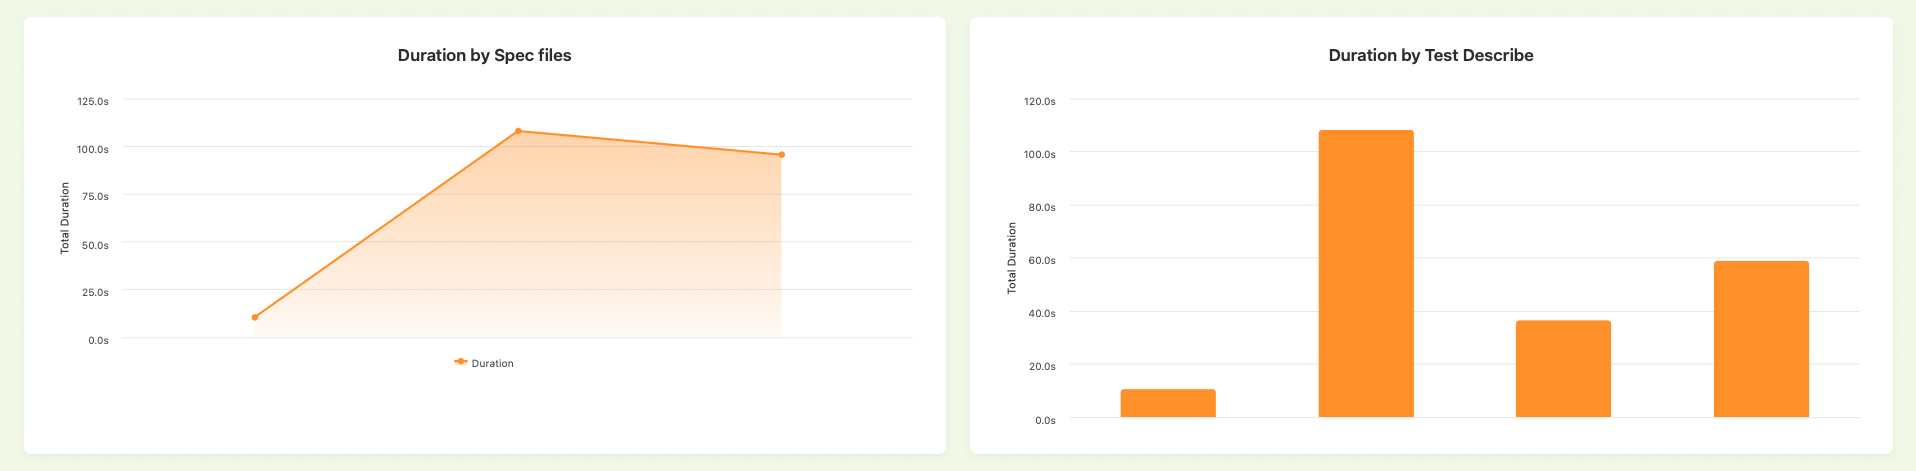
Duration by Spec files and Test Describe Chart
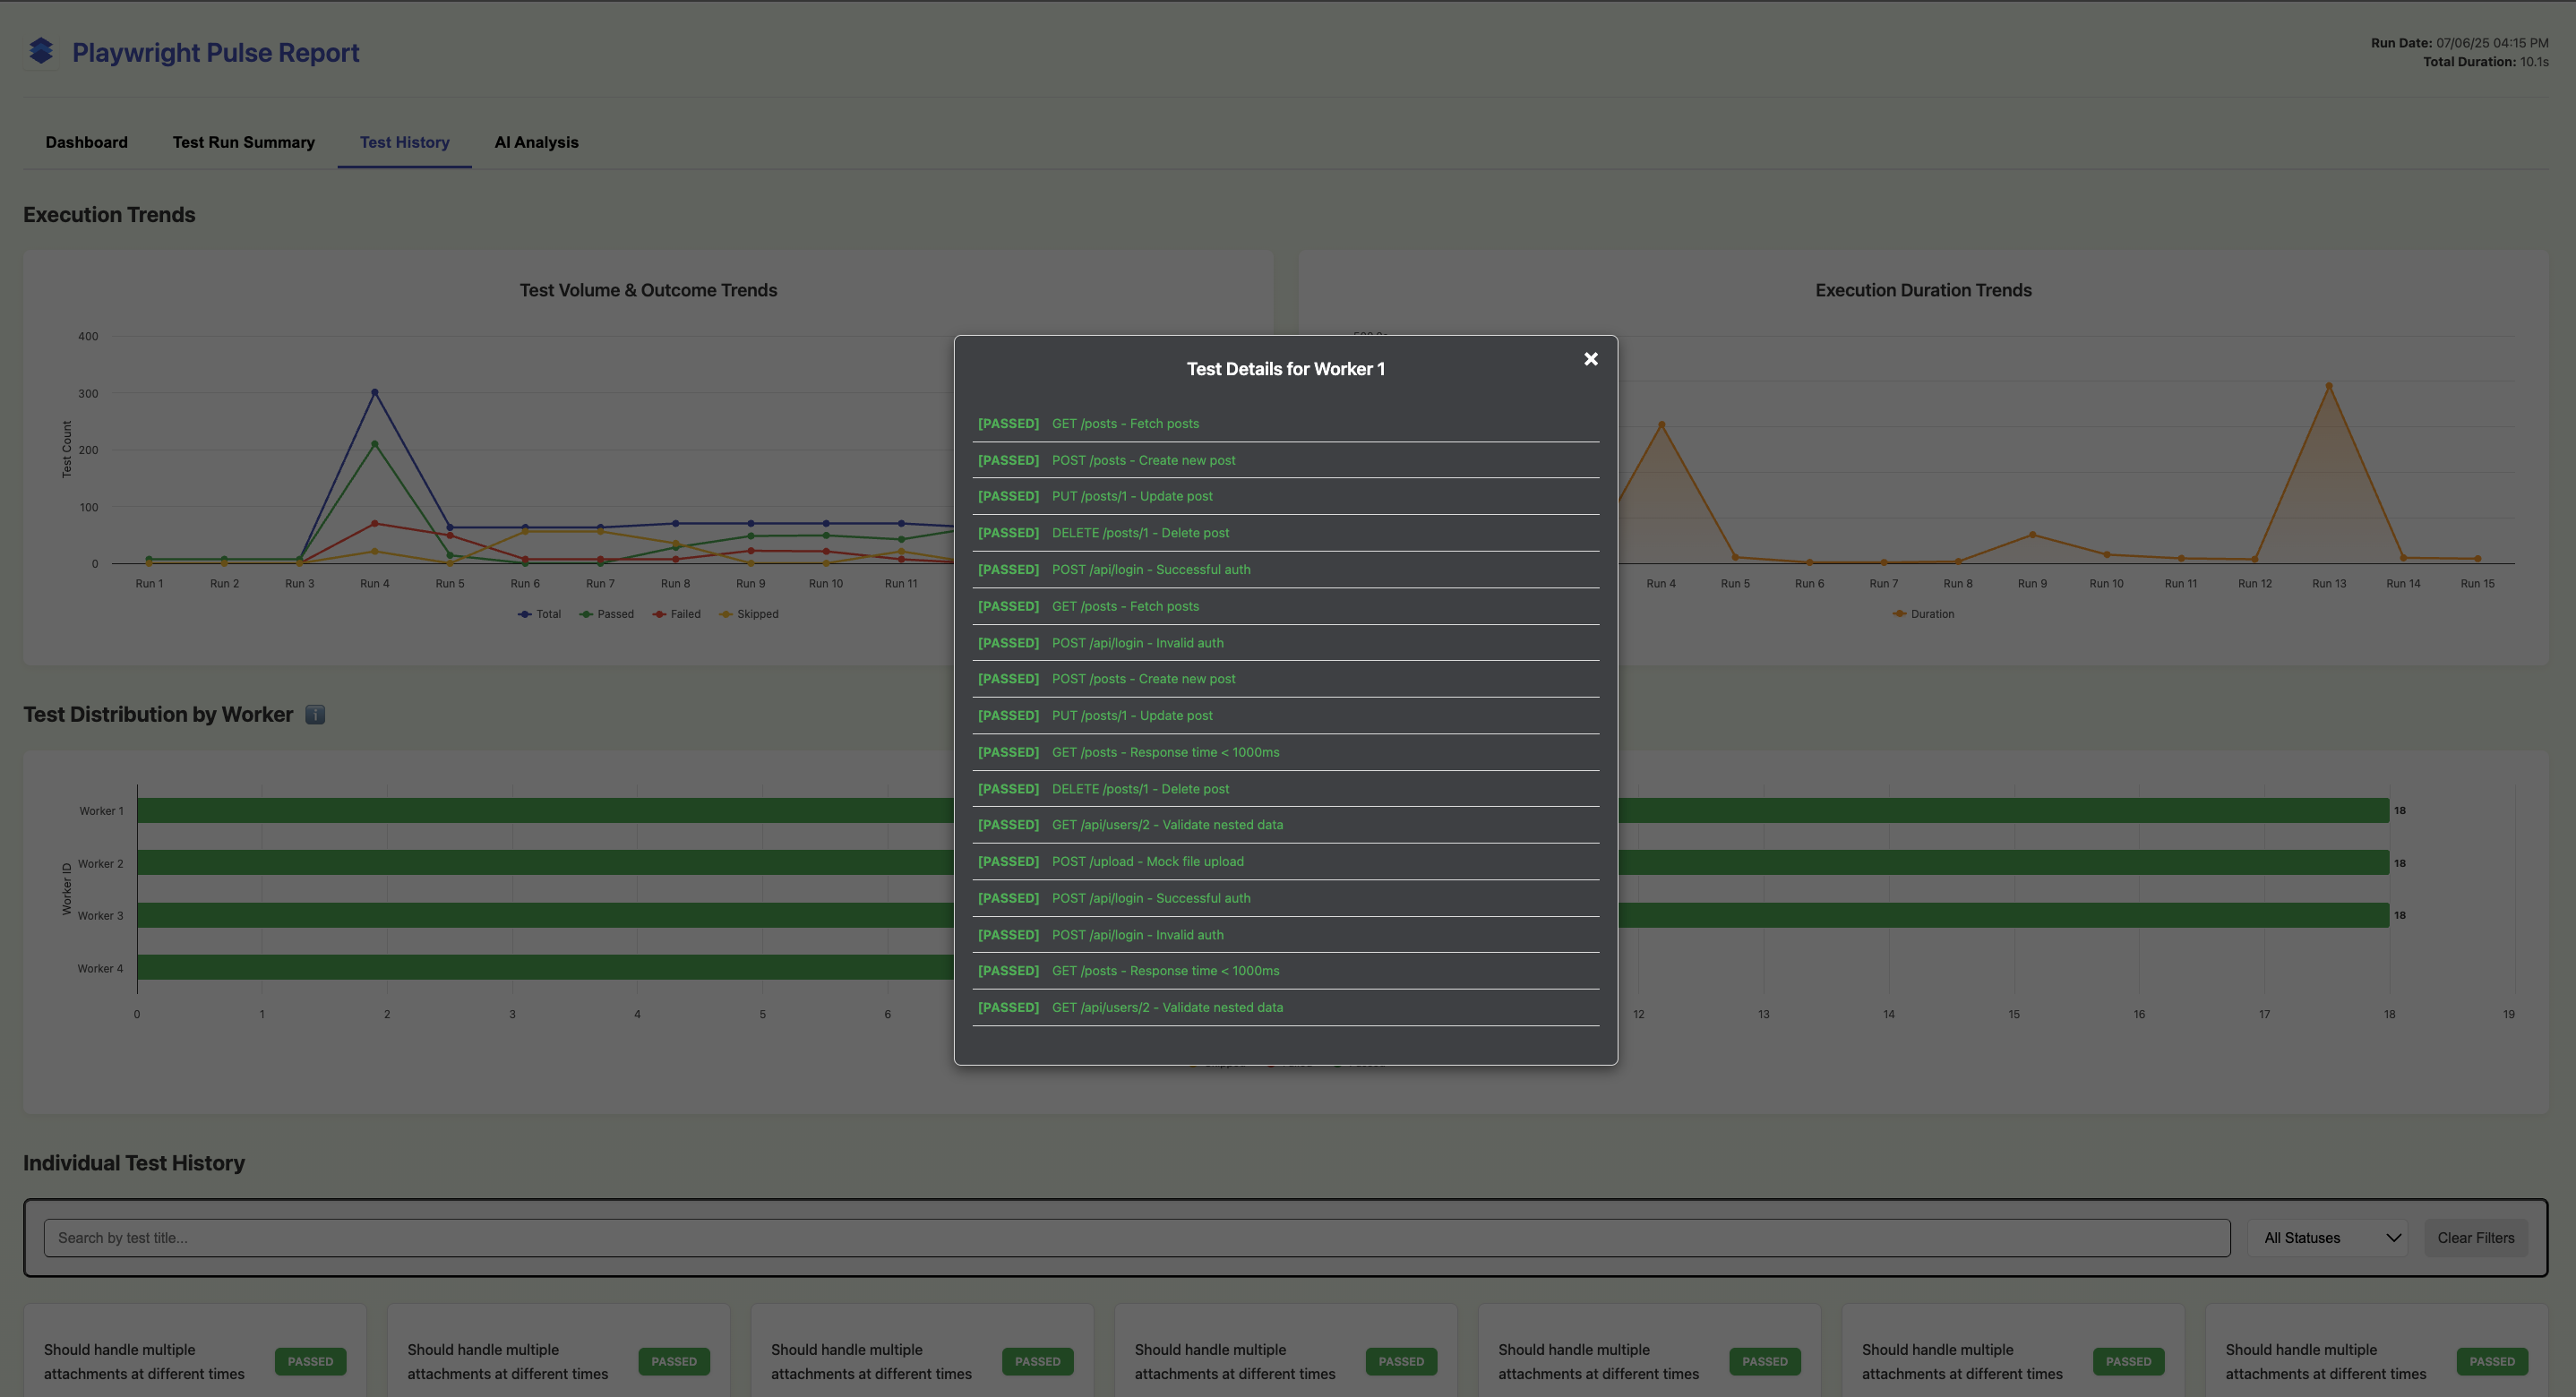
Test Details for Workers
Key Components:
-
Execution Trend Charts: Two main charts show the
evolution of your test suite over time:
- Test Volume & Outcome Trends: A line chart tracking the total, passed, failed, and skipped test counts across runs.
- Execution Duration Trends: An area chart showing how the total run duration has changed over time.
- Duration by Spec files: An area chart showing the duration distribution of tests across different spec files.
- Duration by Test Describe: An stacked-column chart showing the duration distribution of tests across different test describe blocks.
- Test Distribution by Worker: Bar chart for no. of tests, outcomes with respect to each worker.
-
Individual Test History: A grid of cards, one for
each unique test case. Each card shows:
- The latest status of the test.
- A mini-chart showing the duration and status of that specific test over the last 15 runs.
- A collapsible details section with a table of its full run history.
AI Analysis View
This tab embeds an external web tool to provide AI-powered analysis of your test results.
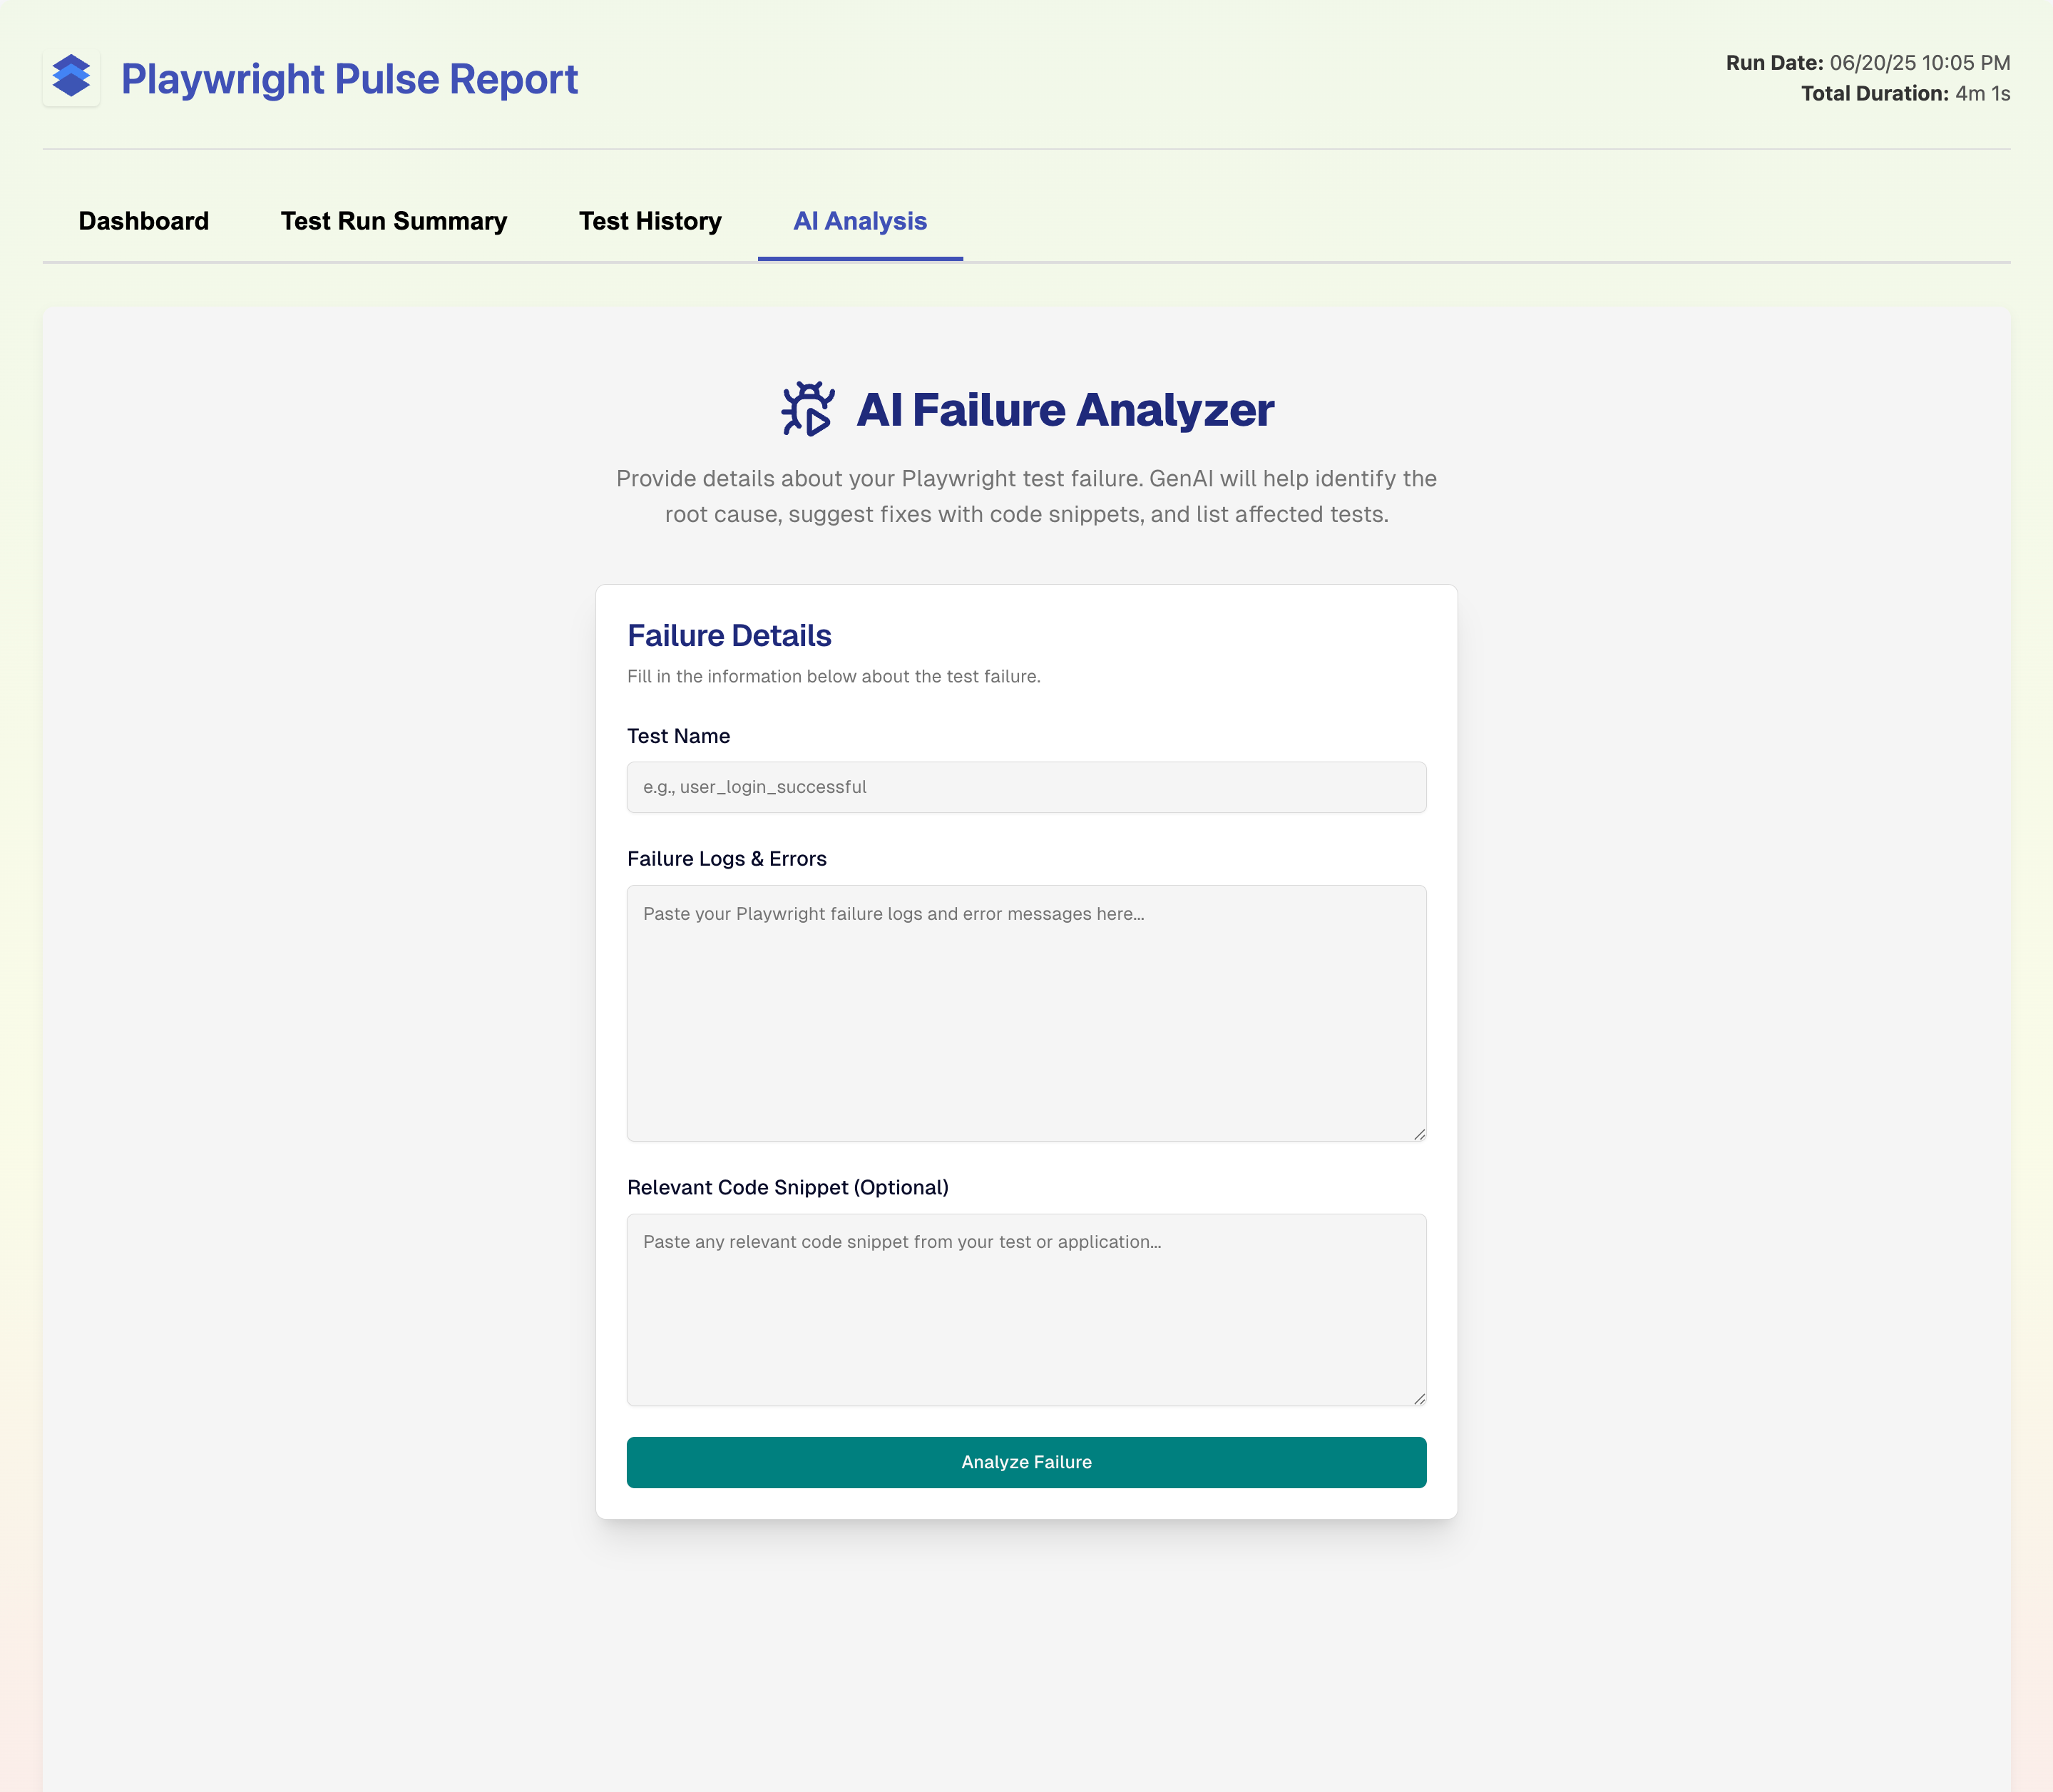
AI Failure Analyzer
Email Report (Default Flow)
RECIPIENT_EMAIL_1=recipient1@example.com
RECIPIENT_EMAIL_2=recipient2@example.com
# ... up to 5 recipientsnpx send-emailnpm run send-email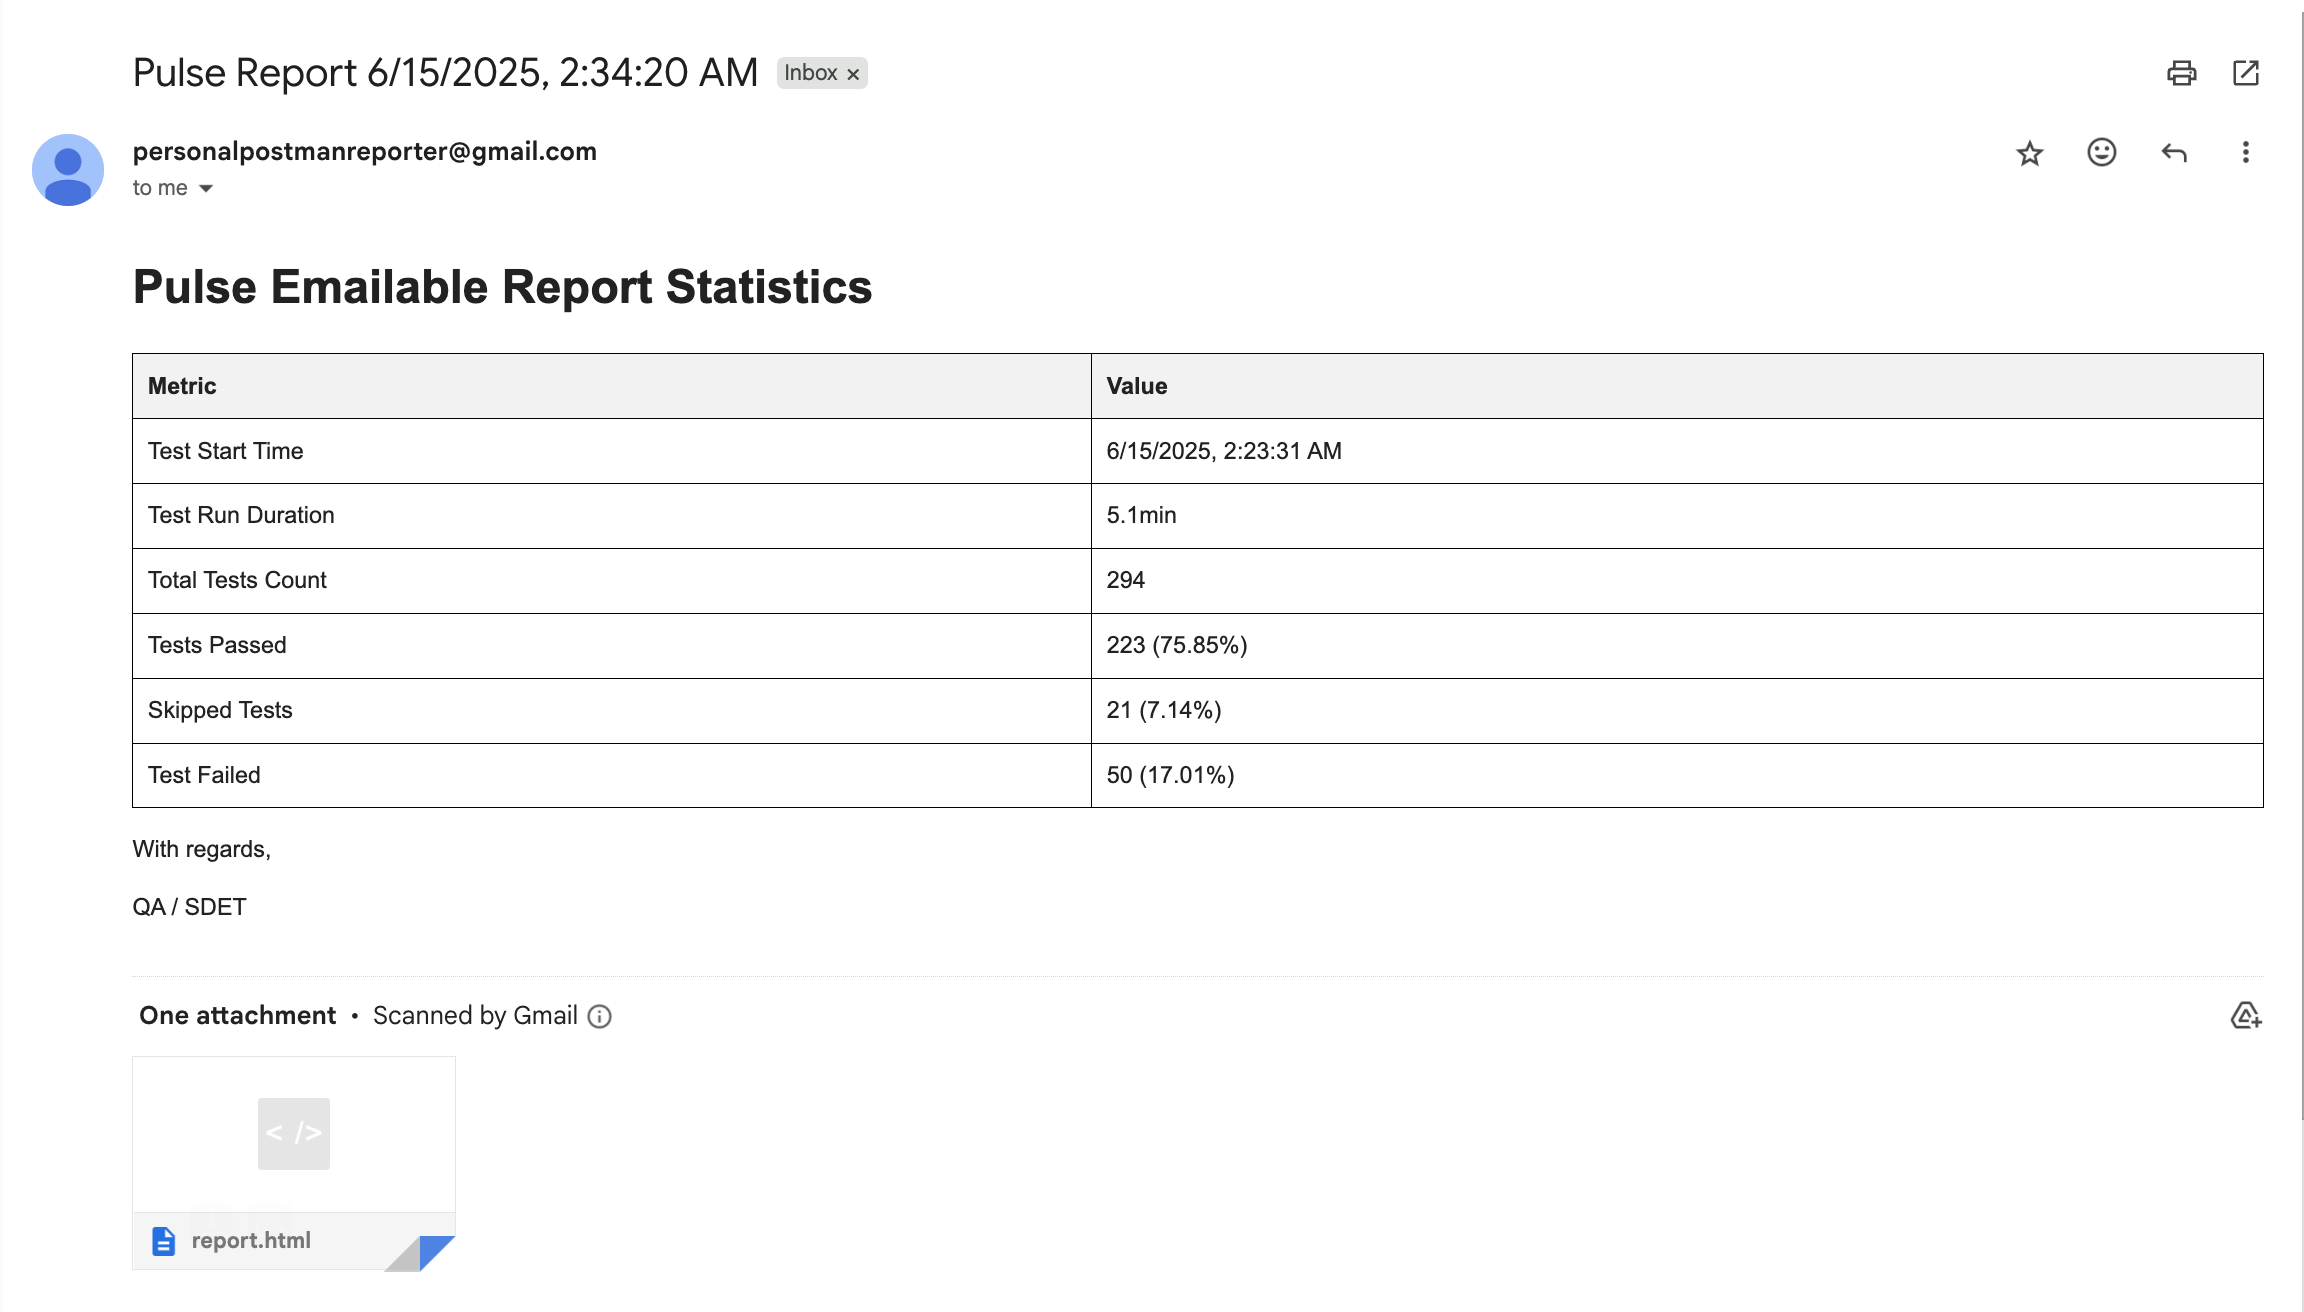
Email template
Email Report HTML
personalpostmanreporter@gmail.com email ID, if needed
kindly check the spam/junk folder to receive the mail.
Email Report (Custom Flow)
1. Configure Recipients
Set up to 5 recipients via environment variables:
RECIPIENT_EMAIL_1=recipient1@example.com
RECIPIENT_EMAIL_2=recipient2@example.com
RECIPIENT_EMAIL_3=recipient3@example.com
RECIPIENT_EMAIL_4=recipient4@example.com
RECIPIENT_EMAIL_5=recipient5@example.com2. Choose Credential Flow
The script supports two ways to obtain SMTP credentials:
Environment-based credentialsProvide mail host and credentials via environment variables:
PULSE_MAIL_HOST=gmail # or: outlook
PULSE_MAIL_USERNAME=you@example.com
PULSE_MAIL_PASSWORD=your_app_passwordPULSE_MAIL_HOSTsupportsgmailoroutlookonly.- For Gmail/Outlook, use an app password or SMTP-enabled credentials.
PULSE_MAIL_PASSWORD3. Run the CLI (for Default & Advanced flow)
Use the default output directory:
npx send-emailOr point to a custom report directory, which can be used in both default and custom flow (note: custom report directory must contain playwright-pulse-report.json):
npx send-email --outputDir <YOUR_CUSTOM_REPORT_FOLDER>`{PULSE_MAIL_USERNAME}` gmail/outlook mail ID, if needed
kindly check the spam/junk folder to receive the mail.